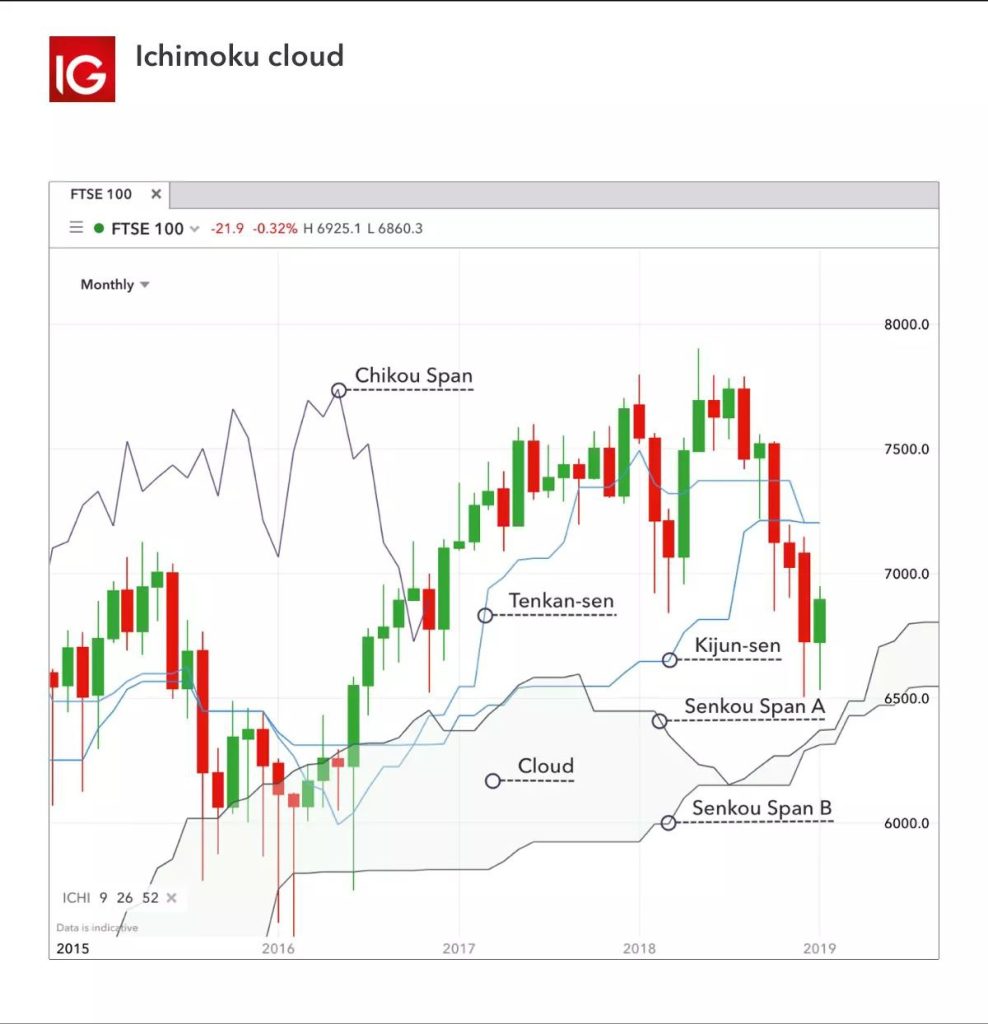
Technical indicators are mathematical calculations – or can even be something as simple as a trendline – that allow traders to identify when an asset is experiencing overbought or oversold conditions. It uses historic price, volume, and open interest information to forecast what direction the financial asset is going. This underlying knowledge can help a trader identify trading opportunities.
A mistake almost all new traders make is to add many indicators onto their charts, regardless of whether the indicators have a purpose, or not.
But as you know, having more indicators doesn’t mean a thing. Instead, they only add “noise” to your trading and make things more confusing.
So, the rule is this:
Every trading indicator on your chart must have a purpose.
For example…
If you want to identify the trend, then you can consider the Moving Average.
If you want to time your entry, you can consider Stochastic or RSI.
If you want to trail your stop loss, you can consider Chandelier Exit or Moving Average.
So, if there’s an indicator on your chart and you can’t find a purpose for it, exterminate it.
You don’t want to have multiple indicators from the same category because they are correlated and doesn’t provide any new information.
That’s like trying to get your wife pregnant in one month by “firing” incessantly. It doesn’t work.
And it’s the same for trading.
So, the rule of thumb is this:
Have only one indicator for each purpose.
I’ll explain…
If you want to trail your stop loss, you can use either the Moving Average or Chandelier Exit — but not both.
Or if you want to time your entry, you can use either the RSI indicator or Stochastic, but not two together because they have the same purpose.
Does it make sense?

