Horizontal Fibonacci retracement lines represent price support and resistance levels.
Fibonacci works well in trending markets. When the market is heading up, go long (or purchase) on a Fibonacci retracement.
When the market is going DOWN, short (or sell) at a Fibonacci resistance level.
Fibonacci retracement levels are a predictive technical indicator that predicts future price. When the market is going DOWN, short (or sell) at a Fibonacci resistance level.
Fibonacci retracement levels are a predictive technical indicator that predicts future price.
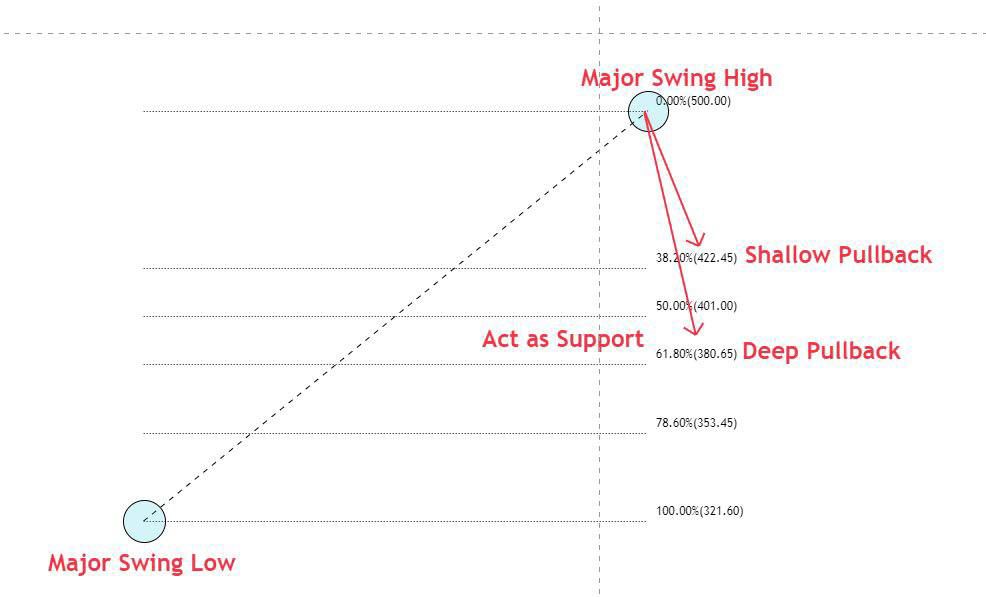
Identification of Fibonacci Retracement Levels.
To locate these Fibonacci retracement levels, it is necessary to identify the most recent Swing Low and Swing High.
Here, the Fibonacci Ret levels were drawn by clicking on the Swing Low and moving the mouse to the Swing High.
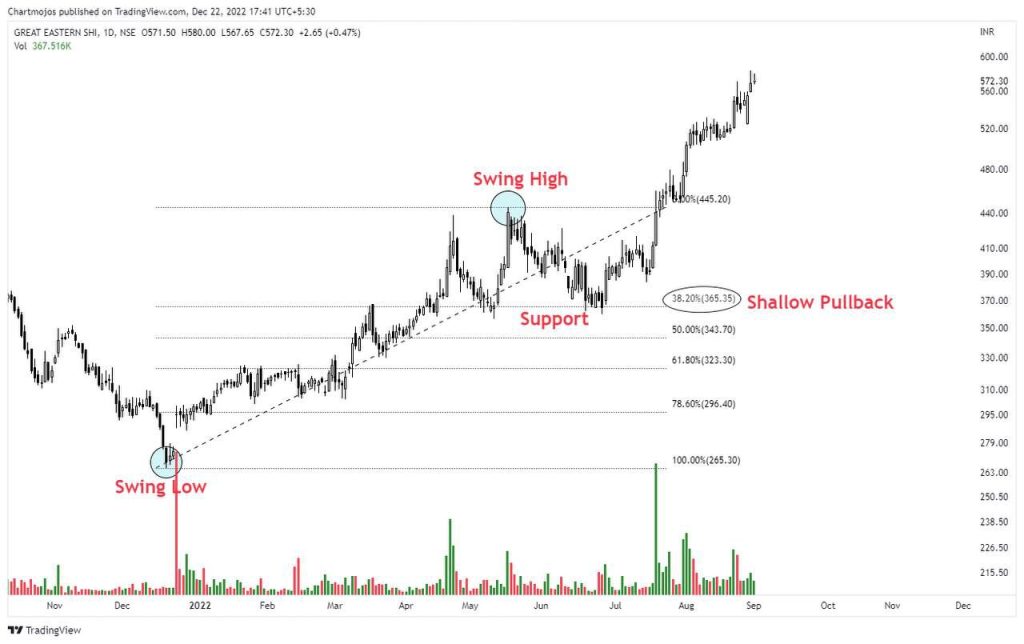
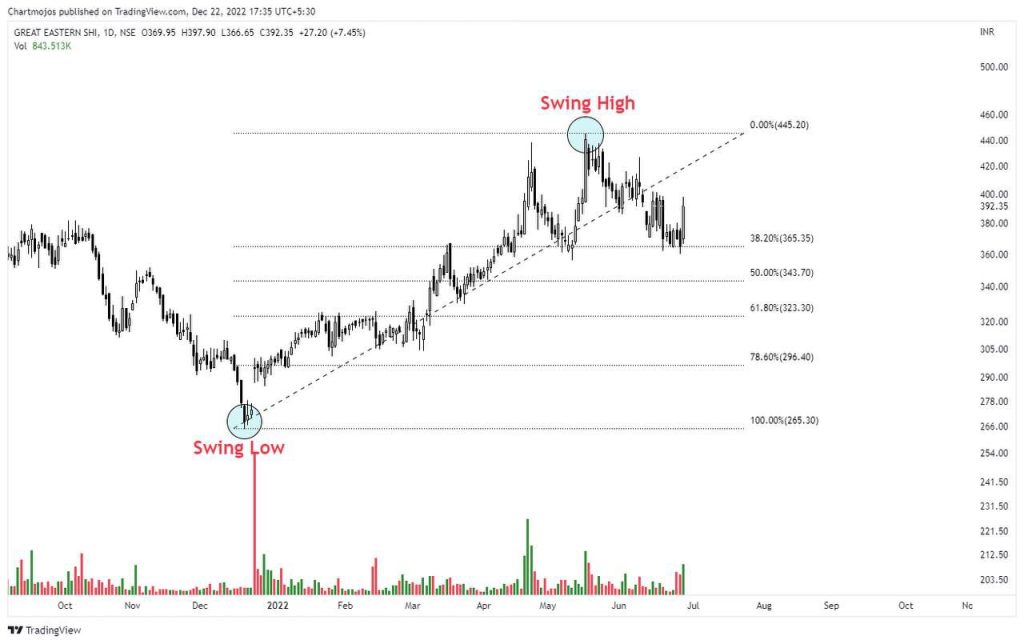
Let’s take a look at what happened after the Swing High.
Price fell straight through the 38.2% mark and held onto it.
After Taking support at 38% of fib retracement, the stock price went up decently.
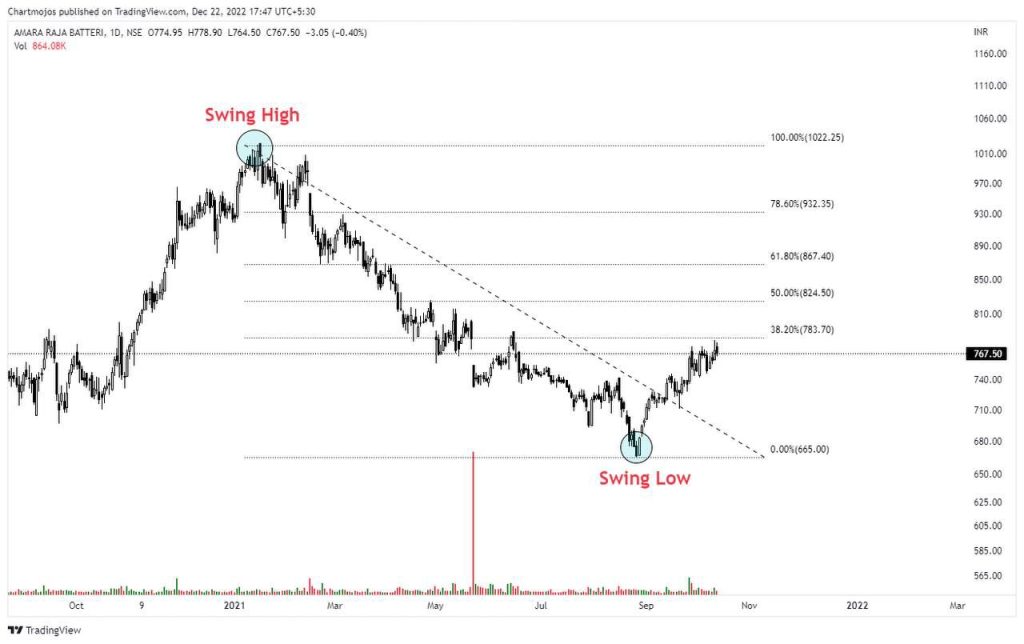
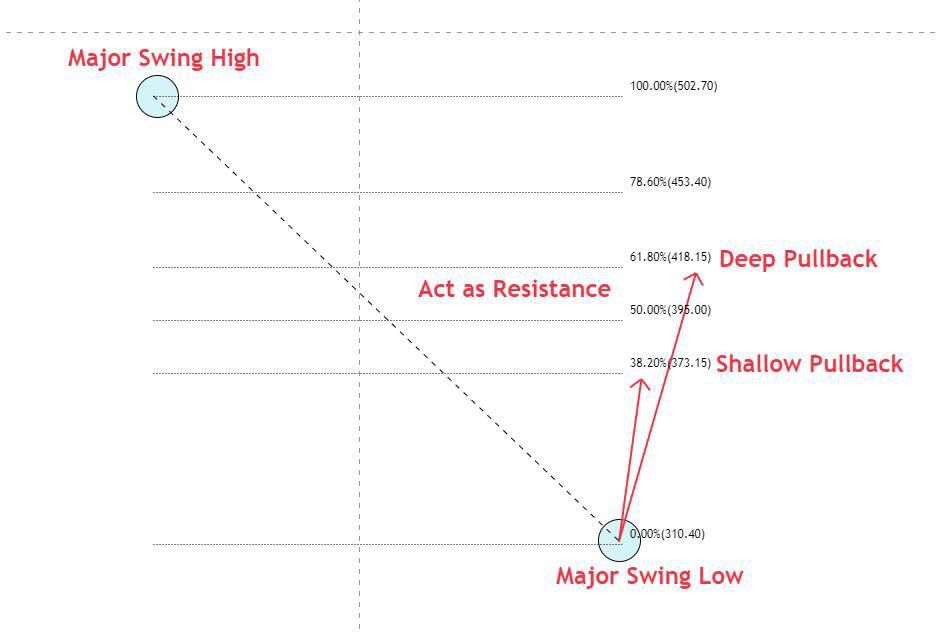
Downtrend
To locate these Fibonacci retracement levels, it is necessary to identify the most recent Swing High and Swing Low in downtrend.
Here, the Fibonacci Ret levels were drawn by clicking on the Swing High and moving the mouse to the Swing Low.
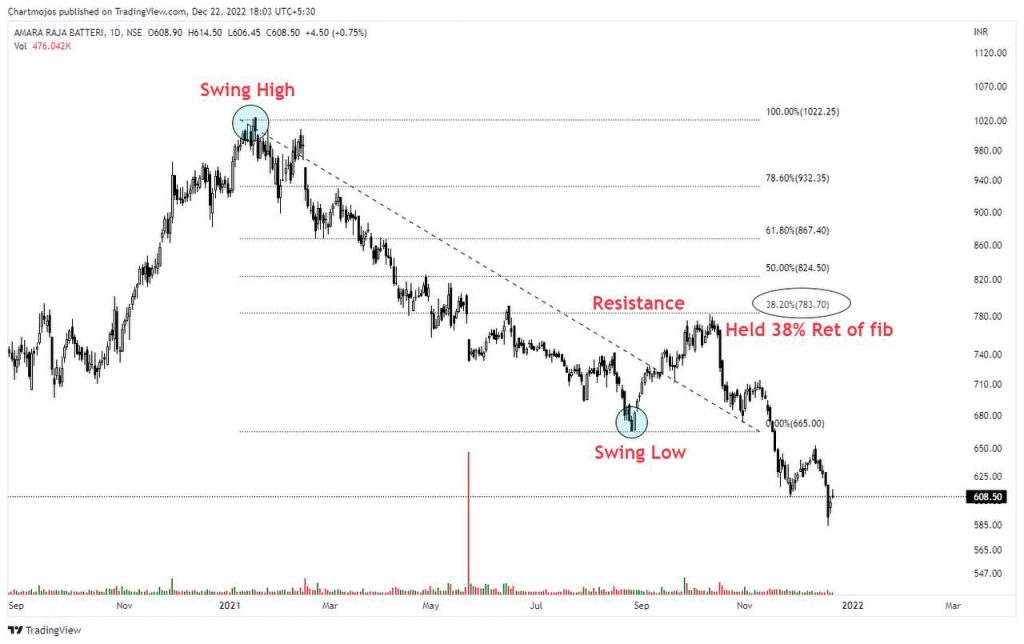
Let’s take a look at what happened after the Swing Low.
Price Rise straight through the 38.2% mark and held onto it.
After Taking Resistance at 38% of fib retracement, the stock price went Down decently.