MOVING AVERAGES
A moving average is a technique to get an overall idea of the trends in a data set; it is an average of any subset of numbers.
The moving average is extremely useful for forecasting long-term trends in sales, prices, yields, population etc.
You can calculate it for any period of time. For example, if you have sales data for a twenty-year period, you can calculate a five-year moving average, a four-year moving average, a three-year moving average and so on.
Financial Market analysts will often use a 50 or 200 day moving average to help them see trends in the financial market and (hopefully) forecast where the prices are headed.
Financial Markets are choppy and erratic in nature; the chart of a certain asset is not as smooth so as to clearly gauge the dominant direction. Traders then came up with this tool to help them smoothen out the choppy price action into a clear line that can show the sense of direction.
Types of Moving Averages
We have three main types of moving averages:
- Simple Moving Average
- Exponential Moving Average
- Weighted Moving Average
The difference is in how they are calculated and averaged. We will not go down to show you the details of how they are calculated since the markets will always do the calculations for you. Any trader who wants to know how to calculate can however do a Google search and that will enable the trader to understand how to calculate the formation of this tool.
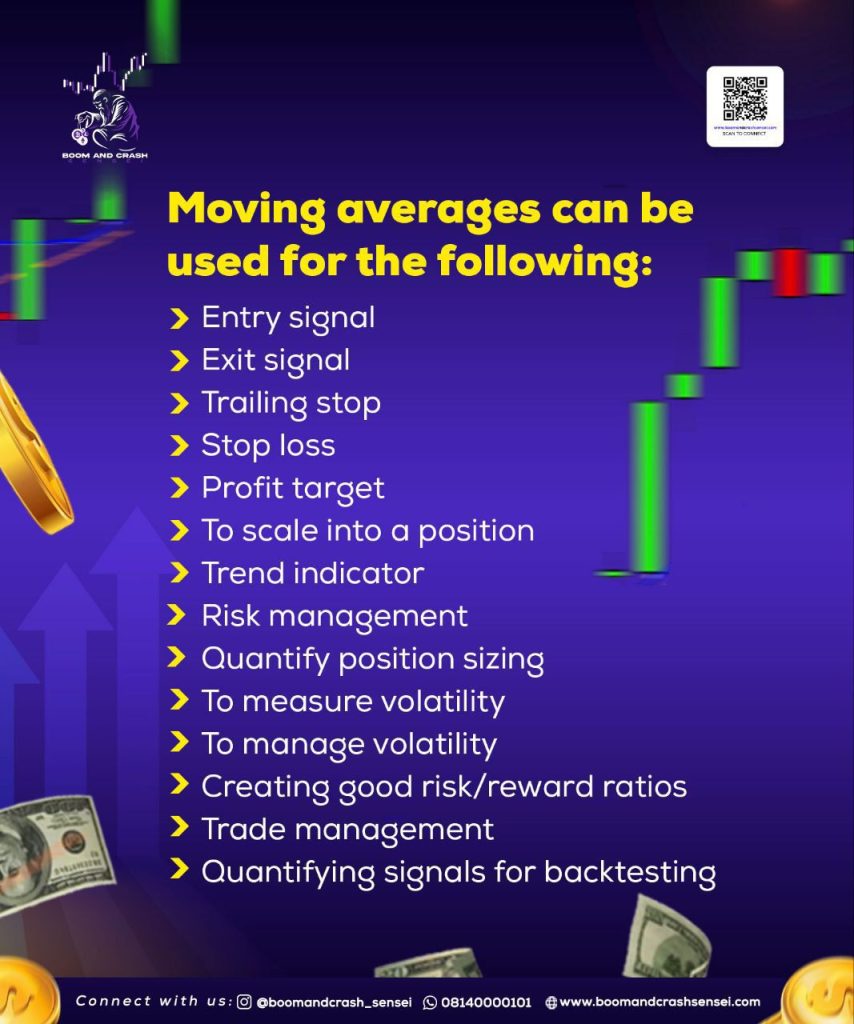
Uses of Moving Averages
Moving Averages serve the main purpose of smoothening out price from the choppy nature of the market.
With that it helps a lot of traders past just smoothening the price, moving averages have been used to:
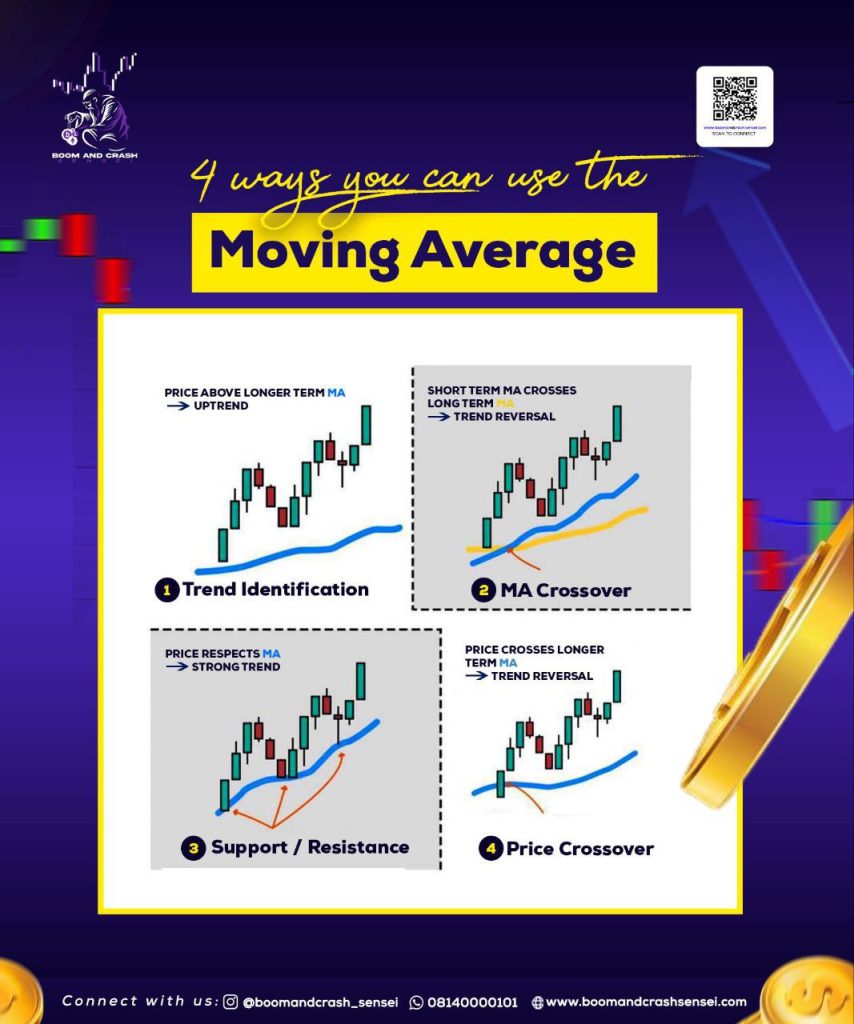
- Confirm the trend.
- Show momentum.
- Find dynamic areas of support and resistance.
- Identify take profits and stop loss levels.