WHAT IS MARKET STRUCTURE!?
Market structure definition: The framework or structure that any particular market is presently trading in. A market structure may assist you to comprehend the behavior, state, and present flow of the market. It indicates support and resistance levels, swing highs, and swing lows
Market structure, as a concept, is nothing new and has been around for as long as financial markets themselves. However, the essential ideas continue to be incredibly important, particularly when it comes to assessing price movement and recognizing trading opportunities.
Market structure functions as a reference for comprehending upward, downward, and sideways patterns. The same ideas may be utilized in every sort of market, from stocks, futures, FX, and commodities, to digital assets like cryptocurrencies or even physical assets like real estate.
Also, the Market structure is simply support and resistance on your charts, swing highs, and lows, These are levels on your chart that gets the most attention, Because traders all over the globe can see them!
And this is where they base all of their trading positions, Like looking to enter the breakout, and looking to place their stop loss at this obvious level, And how you can combine candlestick patterns with market structure is that you are looking to enter your trades after strong price rejection.
Market structure as another definition is the simplest type of price movement in the market and is being interpreted it. It is fundamental support and resistance levels on the charts, swing highs, and swing lows. These are levels, which are readily spotted and hold until they don’t. Market structure is a trend-tracking technique that traders read and follow depending on how an asset moves. From bullish swings, to bearish and in between ranges.
Market Structure is commonly referred to as Price Action. We refer to this research as market structure since it’s how the complete market moves. Understand the pattern and the predicted movements and then you may add more factors to your trade qualifications. Like volume, pivot points, moving averages, and more. Which we shall speak about somewhat at the conclusion of this conversation.
TYPES OF MARKET STRUCTURE
Market structure is simple and a fundamental way of understanding, how markets operate. It’s made easy with only 3 distinct forms of market structure. The market structure may be roughly categorized into three major categories: Bullish Market Structure: A bullish structure is characterized by a succession of higher highs (HH) and higher lows (HL) (HL). The trend continues in the same direction until the asset price records a lower low (LL) (LL). The bull trend is illustrated by higher highs and higher lows. The trend will continue in that way until a lower low is produced by the asset price. The trend starts to show indications of weakening when it fails to print and higher high.
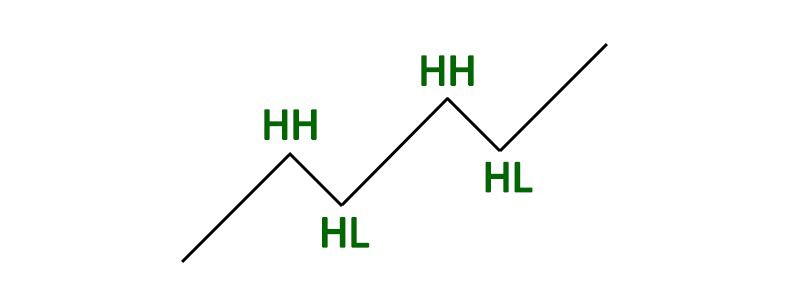
Bullish market structure
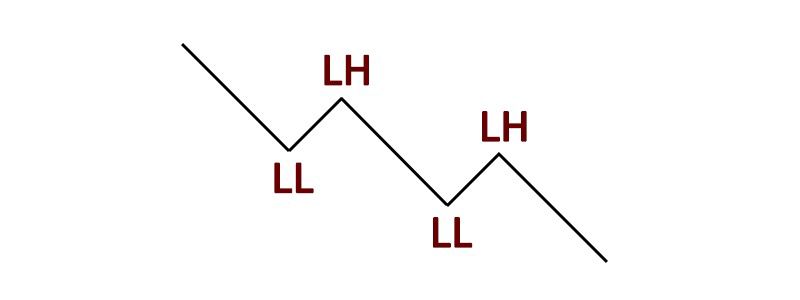
Bearish market structure
Bearish Market Structure: A bearish structure is characterized by lower lows (LL) and lower highs (LH) (LH). The price trend continues as long as lower highs (LH) are being printed and until a higher high (HH) is produced. The bear trend is the price action of lower lows and lower highs. The bear trend will continue to fall as long as lower highs continue to print, once a higher high comes into the price, the trend will end. The sign that the trend may be reversing is price beginning to print higher lows or equal lows
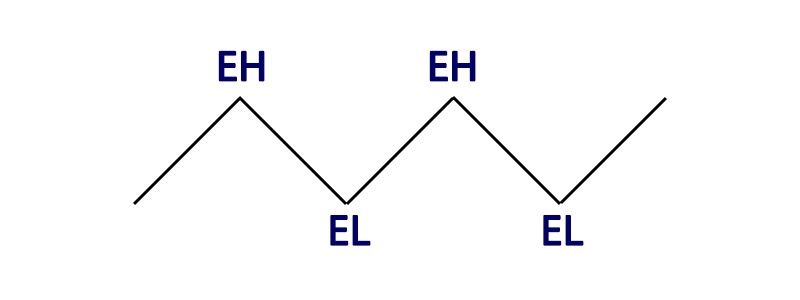
Sideways market structure
Sideways Market Structure : The horizontal movement of price shown by equal highs (EH) and equal lows (EL) is called a sideways trend or sometimes referred to as chop.
Sideways Market Structure: The horizontal movement of price illustrated by equal highs (EH) and equal lows (EL) is termed a sideways trend or often referred to as chop. The sideways trend is a trend that has equal highs and equal lows. Price moves in a range throughout this stage of the market and is in consolidation. Markets may move in a phase of consolidation for a long time. This trend is disrupted if the price breaks out from the top or bottom of the range. This might be the beginning of one of the first two trends.